The Department of Statistics Malaysia (DOSM) counts job vacancies every quarter in its Employment Statistics (Statistik Guna Tenaga). The latest figures cover Q2 2026 and were released on 13 August 2026.
Job vacancies at a glance
| Measure | Q2 2025 | Q2 2026 | Change |
|---|---|---|---|
| Jobs | 9.10 million | 9.25 million | +1.7% |
| Filled jobs | 8.90 million | 9.05 million | +1.7% |
| Vacancies | 194,900 | 195,700 | +0.4% |
| Jobs created | 31,900 | 31,500 | -1.2% |
- There were 195,700 job vacancies in Q2 2026, up 0.4% from 194,900 a year earlier.
- The vacancy rate was 2.1% of 9.25 million jobs in registered private sector businesses.
- Manufacturing had 114,000 vacancies, 58.3% of the total.
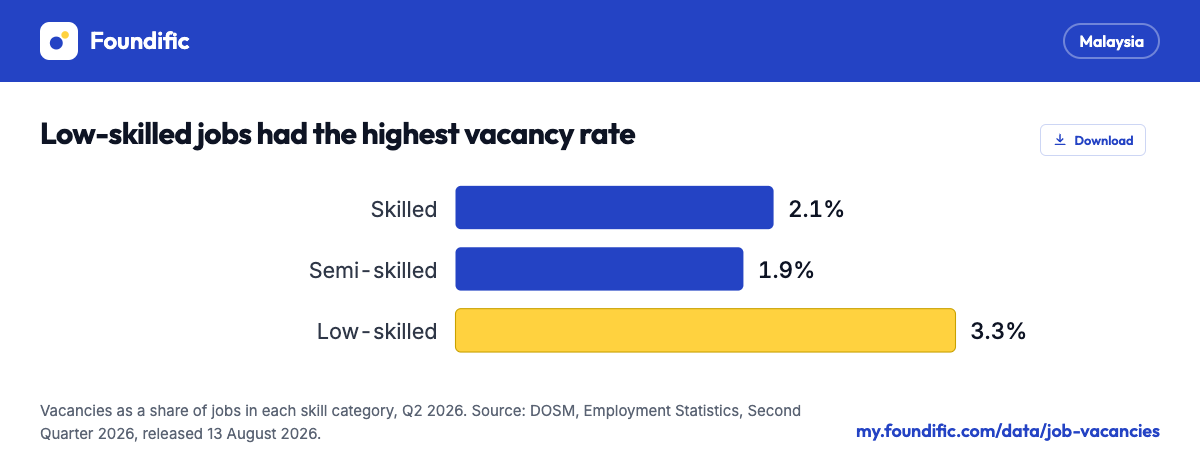
- Low-skilled jobs had the highest vacancy rate, 3.3%.
- Employers created 31,500 new jobs, 1.2% fewer than in Q2 2025.
- Figures for Q3 2026 are due on 12 November 2026.
How many job vacancies are there in Malaysia?
In Q2 2026 there were 195,700 job vacancies, a vacancy rate of 2.1%. The other 9.05 million jobs were filled, a filled jobs rate of 97.9%.
DOSM counts jobs as filled jobs plus vacancies. Q2 2026 compared with Q2 2025:
- Jobs rose by 152,300 over the year.
Vacancies since Q1 2023
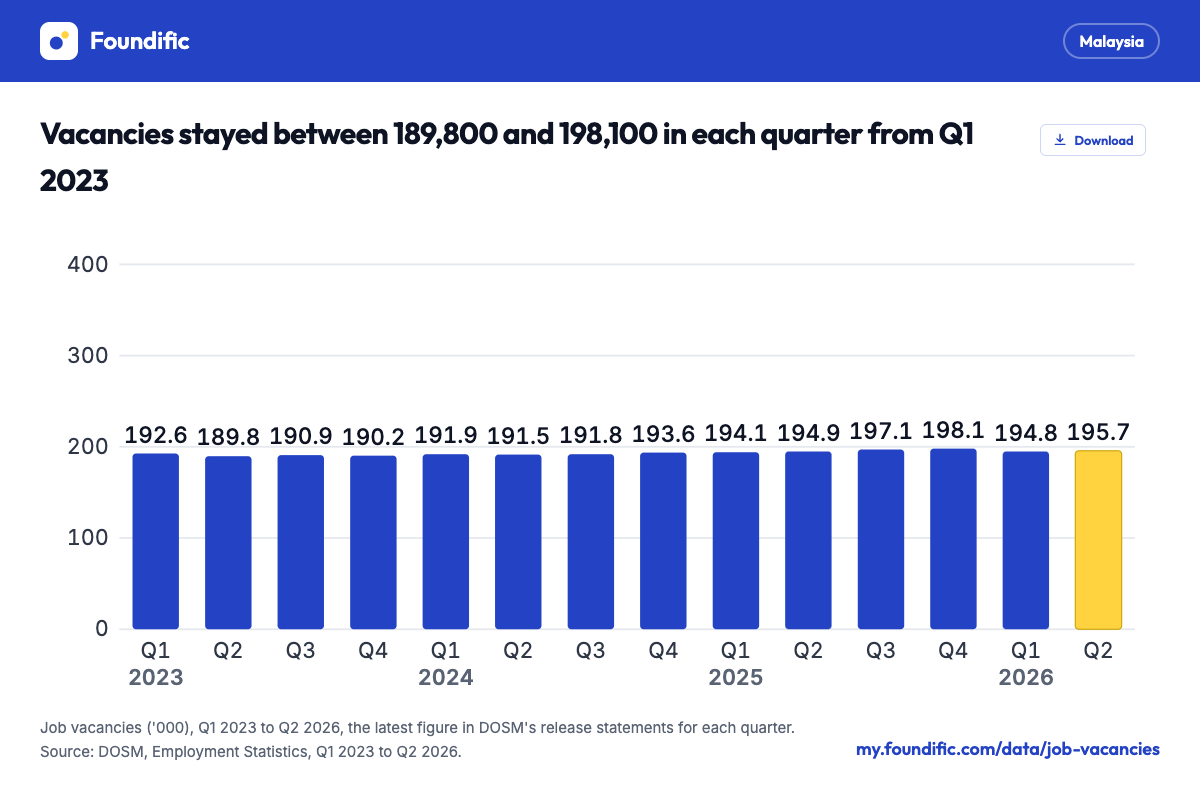
The number of vacancies has changed little since 2023. The vacancy rate has been 2.1% or 2.2% in every quarter.
- Q4 2025 had the most vacancies of these 14 quarters, 198,100, and a vacancy rate of 2.2%.
- Q2 2023 had the fewest, 189,800.
- Vacancies fell to 194,800 in Q1 2026, then rose to 195,700 in Q2 2026.
- Over the same period total jobs rose from 8.81 million to 9.25 million.
Vacancies by sector
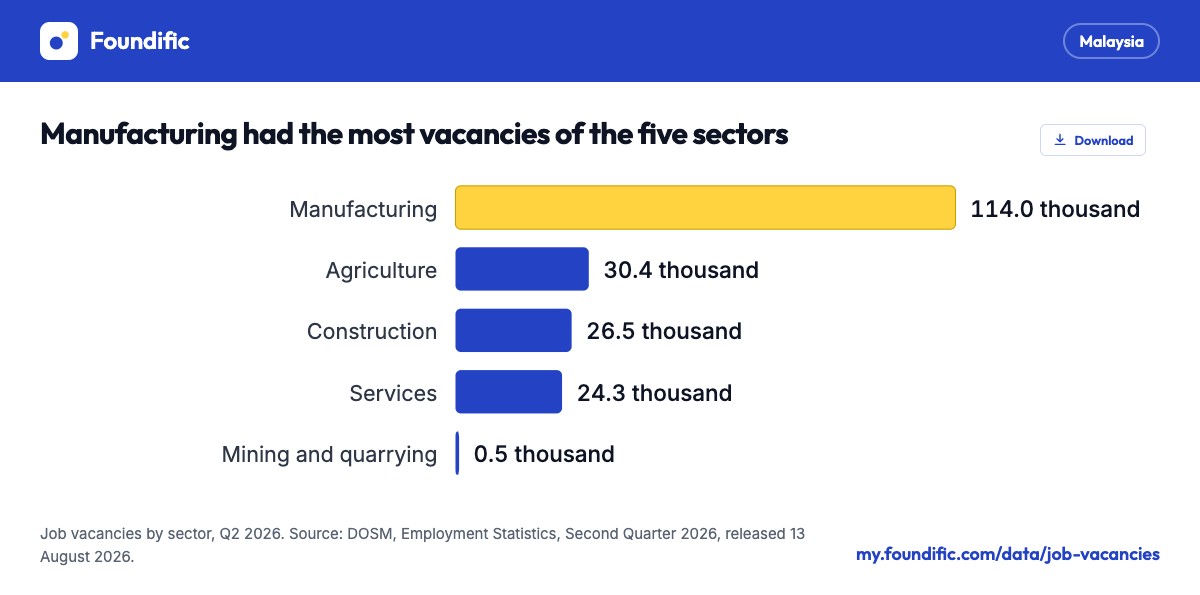
Manufacturing had 114,000 vacancies in Q2 2026, more than the other four sectors combined. Those four had 81,700 between them.
| Sector | Vacancies | Vacancy rate | Share of vacancies | Vacancies, Q2 2025 (as first published) |
|---|---|---|---|---|
| Manufacturing | 114,000 | 4.5% | 58.3% | 112,400 |
| Agriculture | 30,400 | 6.0% | 15.5% | 31,800 |
| Construction | 26,500 | 2.1% | 13.5% | 25,200 |
| Services | 24,300 | 0.5% | 12.5% | 24,800 |
| Mining and quarrying | 500 | 0.6% | 0.2% | 600 |
The vacancy rate is each sector's vacancies as a share of its jobs.
- Agriculture had the highest vacancy rate, 6.0%, on 503,100 jobs.
- Services had 52.5% of all jobs and a vacancy rate of 0.5%, the lowest of the five sectors.
- Services created the most new jobs, 14,400, or 45.7% of the total. Manufacturing created 12,100.
- Wholesale and retail trade was the largest part of services, with 1.82 million jobs.
Vacancies by skill level
DOSM sorts every job into skilled, semi-skilled or low-skilled.
| Skill category | Jobs | Vacancies | Vacancy rate | Vacancies, Q2 2025 (as first published) |
|---|---|---|---|---|
| Skilled | 2.35 million | 50,200 | 2.1% | 48,000 |
| Semi-skilled | 5.74 million | 107,300 | 1.9% | 109,500 |
| Low-skilled | 1.17 million | 38,200 | 3.3% | 37,400 |
- Semi-skilled jobs had 54.8% of all vacancies and 62.0% of all jobs.
- Skilled jobs had 25.7% of vacancies. Their number rose from 48,000 to 50,200 over the year.
- Low-skilled jobs had 19.5% of vacancies from 12.6% of jobs.
- Jobs created in the low-skilled category fell 17.0% from a year earlier, to 2,800.
Vacancies and unemployment
Vacancies measure what employers want to fill. The unemployment rate comes from DOSM's Labour Force Survey.
| Measure | Q2 2025 | Q2 2026 |
|---|---|---|
| Unemployed people | 517,800 | 509,700 |
| Job vacancies | 194,900 | 195,700 |
| Unemployed people for each vacancy | 2.7 | 2.6 |
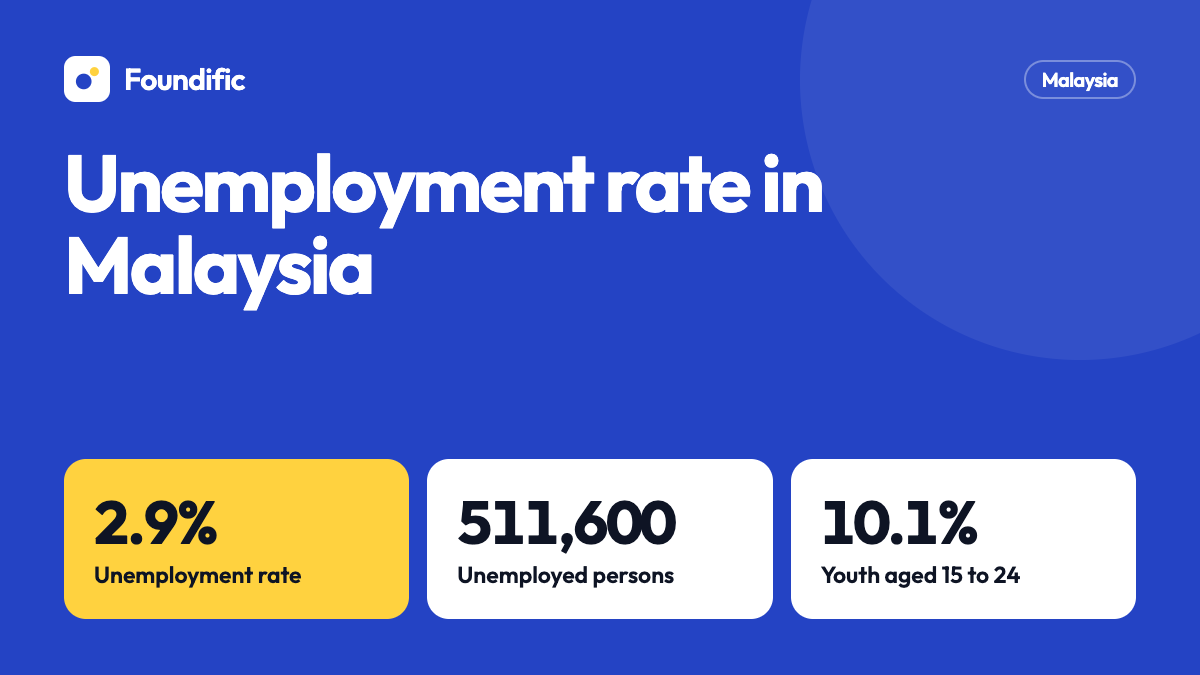
- The unemployment rate was 3.0% in Q2 2026. Unemployed people for each vacancy is a Foundific calculation.
- The vacancy count covers registered private sector businesses only. The unemployment figure comes from a different survey, DOSM's Labour Force Survey, and is a national total.
What this means if you are looking for work
The figures show where employers were hiring in the second quarter of 2026.
- Manufacturing had 114,000 vacancies, the most of any sector.
- Services had 24,300 vacancies and created 14,400 new jobs, more than any other sector.
- Skilled jobs had 50,200 vacancies, 2,200 more than in Q2 2025.
- The Malaysia salary guide has DOSM median pay by sector and skill.
- The calculators work out take-home pay and compare two job offers.
How DOSM counts vacancies
The figures come from DOSM's Quarterly Employment Survey of registered private sector businesses. It covers agriculture, mining and quarrying, manufacturing, construction and services.
- A vacancy is an unfilled job that is ready to be filled, where the employer is actively looking for candidates.
- Looking includes advertising the job, issuing notices, registering with employment agencies and interviewing candidates.
- Filled jobs are paid employees, full-time and part-time. Owners, business partners, unpaid family workers and employees on unpaid leave are left out.
- Jobs created are new jobs that did not exist before, including new service schemes and jobs created for promotions.
- The vacancy rate is vacancies as a share of all jobs.
- Counts are in thousands in DOSM's tables and are shown here in full. Totals may differ from the sum of the parts because of rounding.
- DOSM revises earlier quarters. Q2 2023 was first published as 189,600 vacancies and later as 189,800. The chart uses the latest figure in DOSM's release statements for each quarter. Q3 2025 to Q1 2026 are as first published.
Release calendar
- Employment Statistics for Q3 2026 is due on 12 November 2026, according to DOSM's Advance Release Calendar.
- DOSM publishes the figures about six weeks after each quarter ends.
Questions
How many job vacancies are there in Malaysia?
DOSM counted 195,700 job vacancies in Q2 2026, up 0.4% from 194,900 in Q2 2025. The figures were released on 13 August 2026.
What is the job vacancy rate in Malaysia?
The vacancy rate was 2.1% in Q2 2026: vacancies as a share of the 9.25 million jobs in registered private sector businesses. It has been 2.1% or 2.2% in every quarter since Q1 2023.
Which sector has the most job vacancies in Malaysia?
Manufacturing, with 114,000 vacancies in Q2 2026, or 58.3% of the total. Agriculture had the highest vacancy rate, 6.0% of its jobs.
Are there more unemployed people than vacancies?
In Q2 2026 there were 509,700 unemployed people and 195,700 vacancies, about 2.6 unemployed people for each vacancy (Foundific calculation). The two counts come from different surveys.
When are the next job vacancy figures released?
DOSM's calendar lists Employment Statistics for the third quarter of 2026 on 12 November 2026.
Related guides
Sources
DOSM Employment Statistics, Q1 2023 to Q2 2026, the Q2 2026 Stats Alert and infographic, OpenDOSM lfs_qtr, and DOSM's Advance Release Calendar
- DOSM, Employment Statistics, Second Quarter 2026 Released 13 August 2026. Jobs, filled jobs, vacancies and jobs created, by sector and skill category.
- DOSM, Stats Alert #194, Employment Statistics Q2 2026 Released 13 August 2026. Jobs and vacancy rate, Q1 2023 to Q2 2026.
- DOSM, Infographic, Employment Statistics Q2 2026 Released 13 August 2026. Vacancy rate by sector and the definitions.
- DOSM, Employment Statistics, First Quarter 2023 to First Quarter 2026 Released 11 May 2023 to 14 May 2026. Vacancies in each quarter; earlier releases are linked from each release page.
- OpenDOSM data catalogue: lfs_qtr Unemployed persons, Q2 2025 and Q2 2026.
- DOSM, Advance Release Calendar, November 2026 Employment Statistics, Third Quarter 2026, on 12 November 2026.